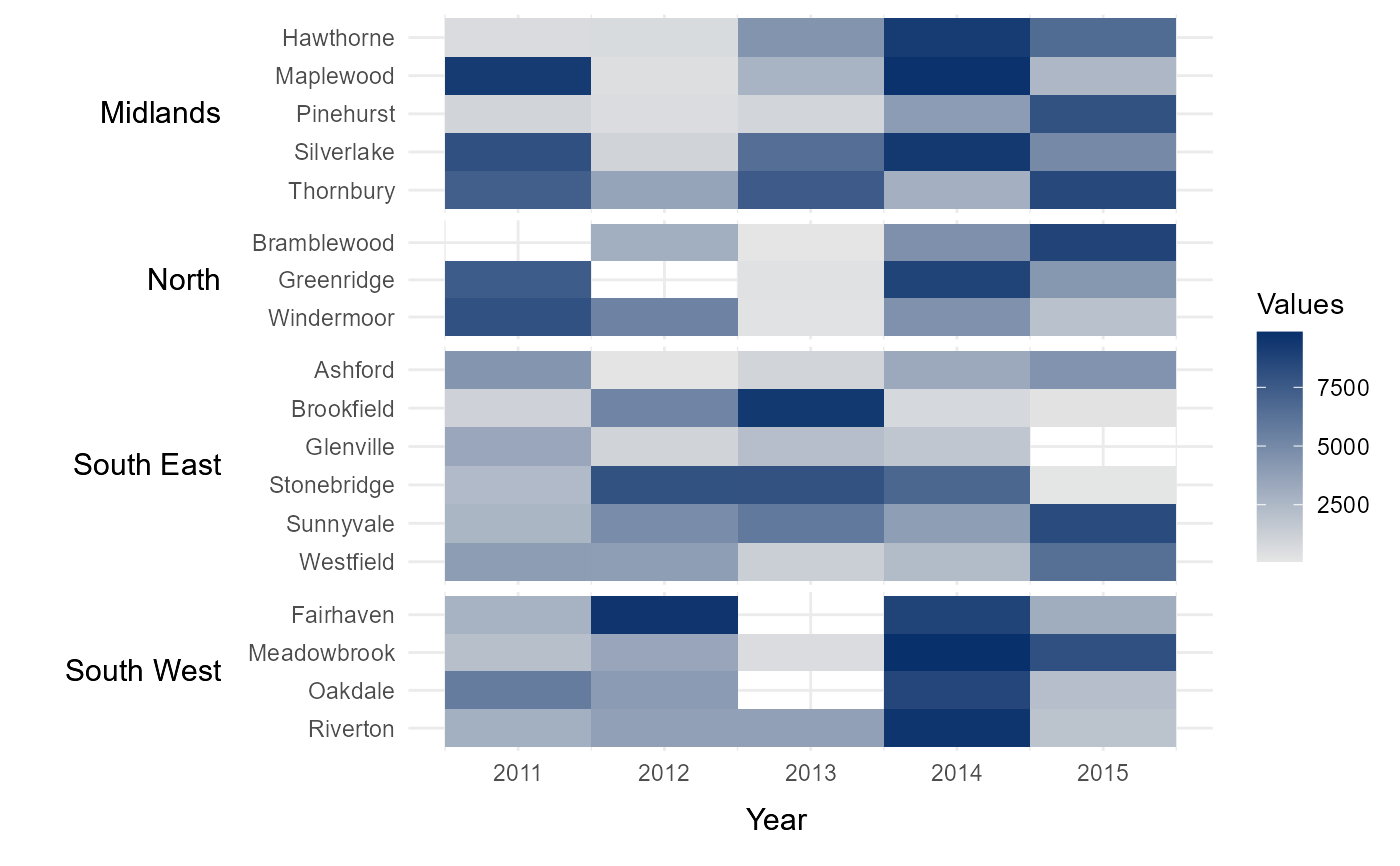
Creates a labelled time-series heatmap from heirarchical data. This function is useful if you wish to create a time-series heatmap where the categories shown on the y axis can be grouped in some way. This heatmap will order the categories by their assigned group and present both the categories and group labels along the y-axis. An example might be series of smaller geographies (lower categories) which aggregate into larger geographical regions (upper groups).
tshhm(
  df,
  lower,
  upper,
  times,
  values,
  sort_lower = "alphabetical",
  lgttl = NULL,
  bins = NULL,
  cbrks = NULL,
  cclrs = NULL,
  norm_lgd = FALSE,
  lgdps = 0,
  na_colour = NULL,
  xttl_height = 0.05,
  yttl_width = 0.15
)
Arguments
- df
A data.frame with containing values with which to populate the heatmap. The data.frame must include columns specifying the lower categories (`lower`) and upper groups (`upper`) that each value corresponds to. These categories and groups will be used to arrange and label the rows of the heatmap. `df` must also contain a `values` variable, containing the values used to populate the heatmap, and a `times` variable, containing the time period during which each value was observed. Note that the groups in `upper` will by default be arranged alphabetically (top to bottom). The ordering of the groups can be manually specified by converting `upper` to a factor. In this case, the groups will be ordered based on the ordering of the factor levels. The ordering of rows within each group can also be specified using the `sort_lower` variable.
- lower
A column in `df` containing the categories that will be presented as rows along the y-axis of the heatmap.
- upper
A column in `df` containing the groupings that will be used to arrange the heatmap rows.
- times
A column in `df` containing the time-period during which each each value in `values` was observed.
- values
A column in `df` containing the values used to populate the heatmap.
- sort_lower
Option to define how rows (lower) within each group (upper) are ordered. The default option is `alphabetical`, which orders rows in alphabetical order from top to bottom. Other options include `sum_ascend` and `mean_ascend`, which order rows in ascending order (top to bottom) based on the row totals and row means respectively. This order can be reversed with the options `sum_descend` and `mean_descend`.
- lgttl
Option to manually define legend title.
- bins
Option to break the data into a specified number of groups (defaults to `NULL`). The thresholds between these groups will be equally spaced between the minimum and maximum values observed in `values`.
- cbrks
Vector of custom breaks, if users wish to use a discrete legend colour scheme (defaults to `NULL`). For example, a supplied vector of `c(5,10, 20)` would break he values up into 5 ordered groups of ranges 0, 0-5, 5-10, 10-20 and 20+.
- cclrs
Vector of hexcodes, which to create a custom legend colour scheme (defaults to `NULL`). If `cbrks` is supplied, `cclrs` must have a length two longer than `cbrks`. If `bins` is supplied, `cclrs` must have a length equal to the values provided to `bins`.
- norm_lgd
Normalised to between 0 and 1 in legend (defaults to `FALSE`). Allows for consistency when comparing heatmaps across different datasets. At present, this only works if all heatmap values are positive.
- lgdps
If using custom breaks, define the number of decimal points to round the legend scale to (defaults to 0). If `norm_lgd` is `TRUE`, it will default to 3.
- na_colour
Option to define the colour of NA values in the legend (defaults to `NULL`, meaning NA values will be assigned no colour).
- xttl_height
The space allocated to the title on the x-axis as a proportion of the heatmap's height (defaults to 0.05).
- yttl_width
The space allocated to the group titles on the y-axis as a proportion of the heatmap's width (defaults to 0.15).
Value
A ggplot object containing the final heatmap.
Examples
library(dplyr)

# Import toy demonstration dataset (see `?example_time_series` for see details)
data(example_time_series)

# Intial heatmap
time_series_heatmap = tshhm(df = example_time_series,
                            lower  = "County",
                            upper  = "Region",
                            times  = "Year",
                            values = "Immigration",
                            yttl_width  = 0.25)

# View result
time_series_heatmap


# For more details, see the package vignette at
# https://sgmmahon.github.io/hhmR/articles/hhmR_overview.html